Overview
This project was a part of my Human Centered Computing class. The task was to
create a sufficiently unique design that created a valuable experience in a specific area and then recruit users to gather meaningful data which will provide useful data for at least a formative and even a summative evaluation
In other words, My professor was being vague on purpose.
The Problem
My guiding post in this entire project was to identify a real problem, because a Interaction Design that doesn't solve a problem is excess design that hinders users
While brainstorming for ideas on how to come up with unique ways improving interaction that could render itself well for usability research we couldn't agree on any of the ideas. My friend Aaron then brought up the Wikipedia browsing problem. Here is how it happens:
- You start browsing Wikipedia for any topic that you wanted to search about say 'rock and roll'
- You come across a link about a band that you know about and you click on it
- You start browsing randomly about their influences, their philosophy and where they have toured
- You find yourself reading a page about the American Revolutionary War
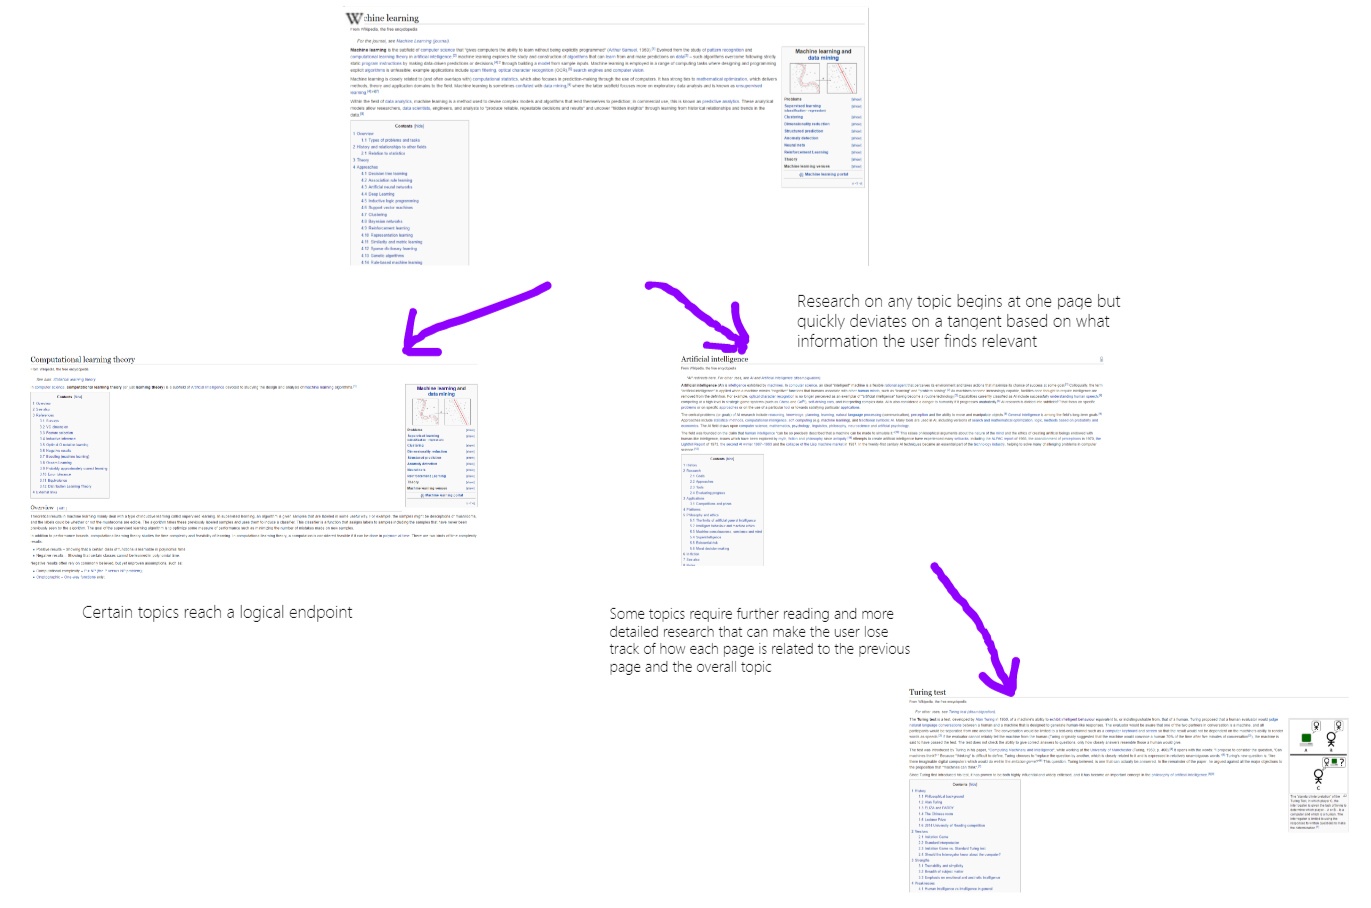
The only question you are then left with is:
Design Process
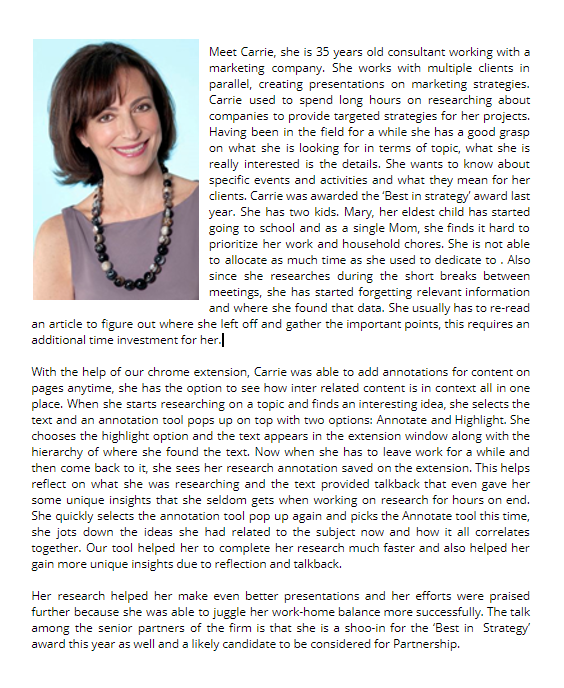
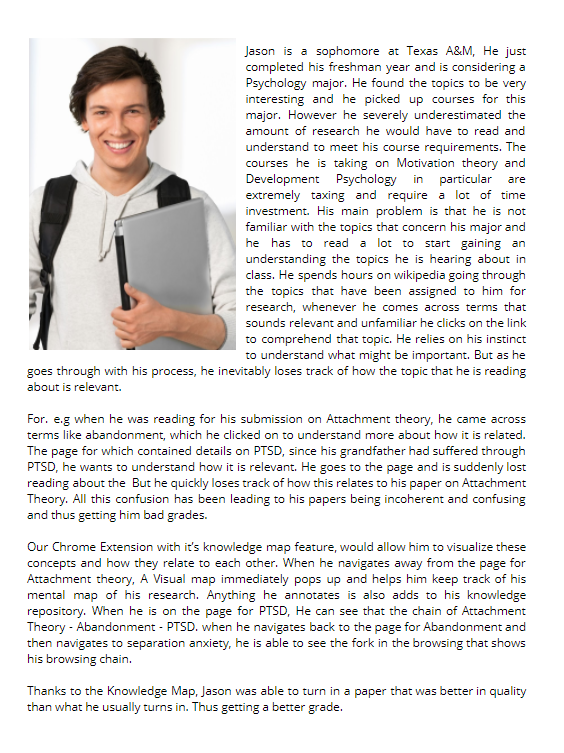
USER Personas
Wireframes & Design Prototype
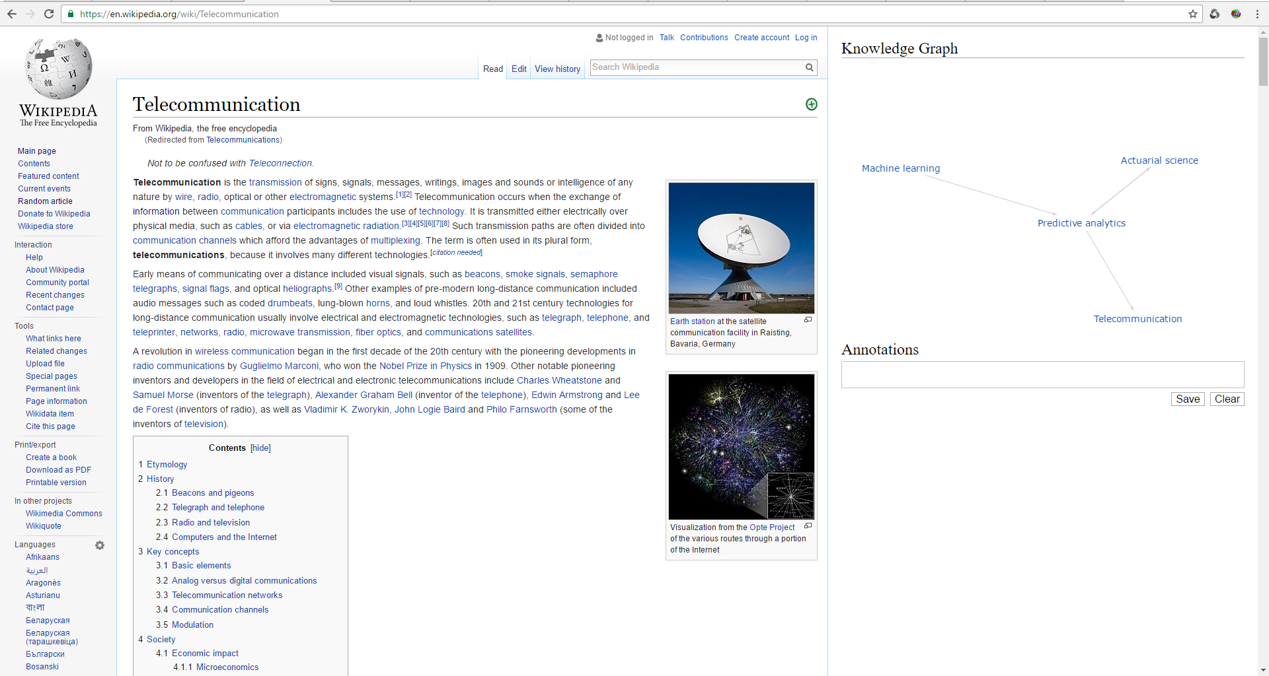
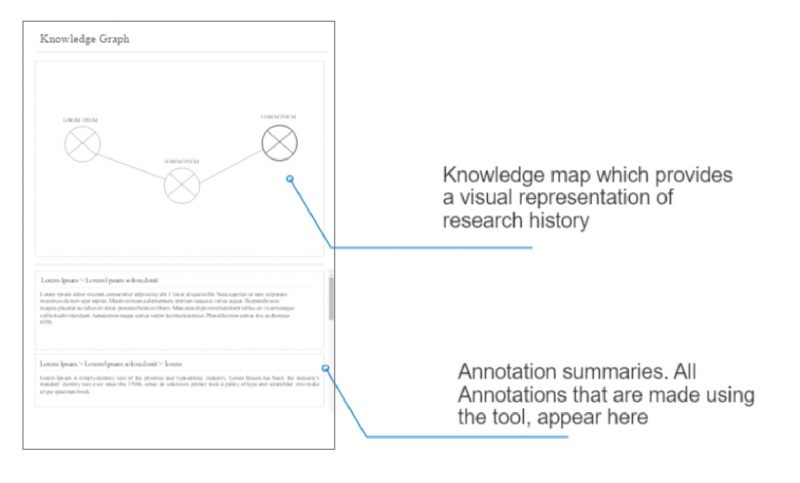
I remembered this old image of the google Knowledge graph which showed bubbles of information related to each other. This became the inspiration for our first prototype. The idea was to embrace history in its real dimension and not as a list of links that you visited and not even a linear breadcrumb but a 2-dimensional graph which tracks your progress in all directions, backwards forwards, through forks in browsing. This creating a realistic representation of the browsing history. We called this a knowledge graph after its namesake

High Fidelity Prototype video
The Wireframes were built together in proto.io to create a working prototype which we put in front of the users for our first usability test.
The idea was then put to test, we took user feedback, iterated design, performed usability testing and even wrote down the research implications.
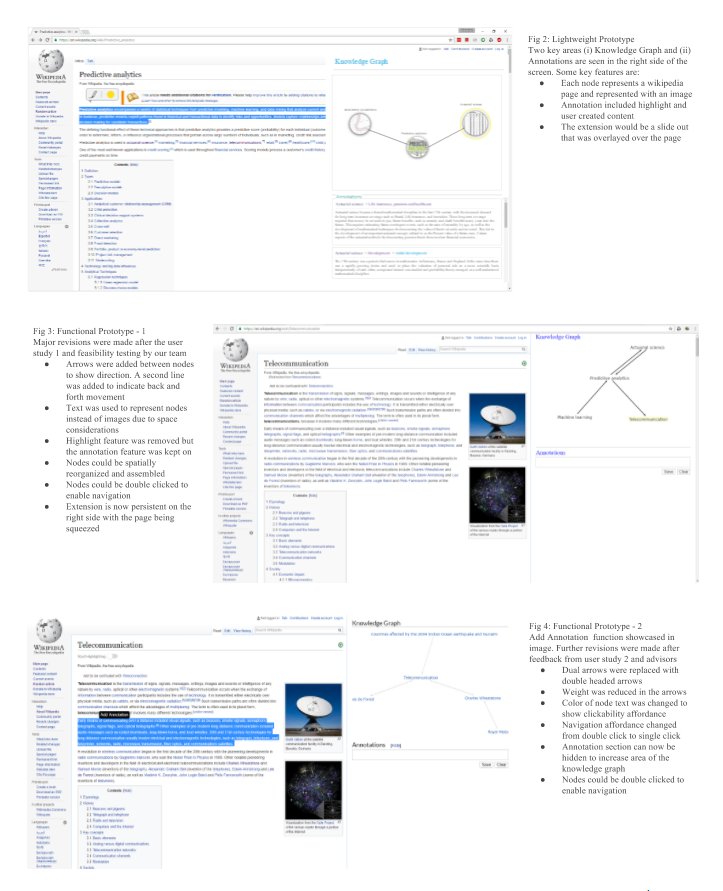
Design Evolution
USER RESEARCH
Methodology
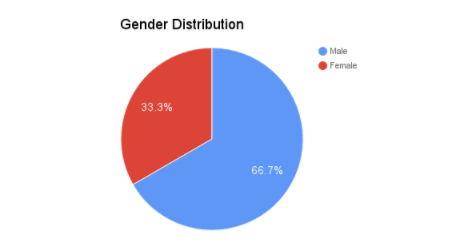
For this study we had ten participants, all of which were college students or postgraduates, ranging between the ages of 20 and 36. Gender distribution was 7 male, 3 female.
We provided users with two topics to summarize, split them into two groups and asked them to perform one task using our tool and the second without in different orders
Evaluation
We evaluated the result based on these criteria
- Annotation Trail Experience
- Support for Sensemaking
- Brevity
- Accuracy
- Key Content
Results
We found that such a tool improved sense-making and increased learning ability for anyone trying to learn. This tool could ideally be ported to be a universal browsing history tool. but its utility is magnified in a closed sandbox environment.
We observed that our system changed the way users would spatially arrange or organize their notes, either through our knowledge graph implementation or through imitation of its design. The knowledge graph was shown to be the most novel implementation of our tool and the most informative of our results. We found evidence of the knowledge graph supporting a retrospective sensemaking, which can be more thoroughly explored.
